
Weekend Long Read: Deciphering China’s Housing Conundrum
Five cities in China have been listed among the world’s top 10 cities with the highest housing prices, according to our research.
It’s not surprising. The serious shortage of land supply, uneven distribution of resources among cities and excessive liquidity have led to a situation that is often overlooked — that housing prices in first- and second-tier cities in mainland China are determined not by the buying power of local residents, but by high-income groups across the country.
How to resolve this? We suggest accelerating a new round of housing reforms and establishing a long-term real estate mechanism centered around a system that connects people with land, and of course, liquidity control and the introduction of property tax, thereby promoting long-term, stable and healthy development of the real estate market. We only have about 10 years to resolve this problem, before it becomes too late.
Because of factors such as incomplete statistics on individual income, high savings rate and fast economic growth, China’s housing price-to-income ratio and rental rate of return are not internationally comparable.
 |
Sidebar: Methodology of comparison
The administrative area of Chinese cities is larger than that of Western cities.
For example, Beijing’s area of administrative division is 16,000 square kilometers, far greater than that of Tokyo (2,188 square kilometers), London (square kilometers), New York (789 square kilometers) and Paris (105 square kilometers) put together. To make a sensible comparison, we chose central urban areas and areas about 8 kilometers away from central areas (which are defined as peripheral areas).
Specifically, Beijing’s central area refers to Dongcheng and Xicheng Districts, and the peripheral area refers to the area between the 4th Ring Road and the 5th Ring Road; Shanghai’s central area refers to the inner ring, and the peripheral area refers to the area between the middle ring and the outer ring. New York’s central area refers to Midtown and Lower Manhattan, and the peripheral area refers to the area about 8 kilometers away from Manhattan. London’s central area refers to London Zone 1, and the peripheral area refers to the area between Zone 3 and Zone 4. To ensure the uniformity of caliber data, the house price data of central and peripheral areas are taken from Numbeo, the world’s largest living information website.
In addition, statistical caliber must be paid attention to when comparing international housing prices. The statistical caliber of the housing area in mainland China is floor area, including usable area, building area and shared area, while that in most countries and regions is construction area or usable area.
Among Global Top 10 – Beijing, Shanghai, and Shenzhen
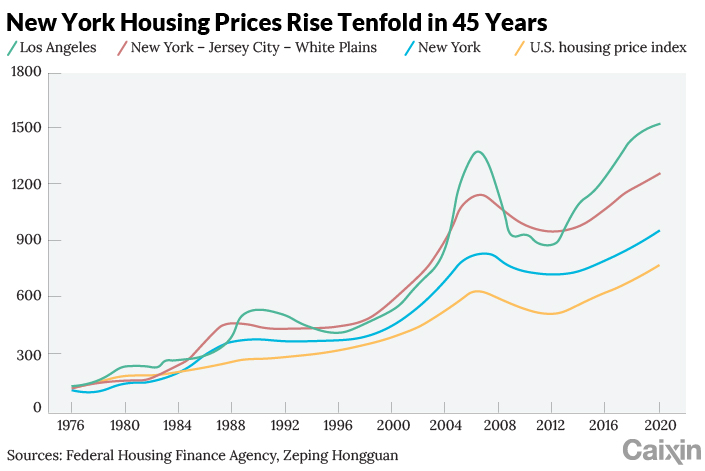
Between the Q1 of 2009 and the Q1 of 2021, house prices in Beijing, Shanghai and Guangzhou increased by more than 3.5 times, much higher than the national average. It’s natural. High housing prices and higher growth in core cities go hand in hand in most parts of the world.
 |
After translating into comparable usage areas, housing prices in central and peripheral areas of Beijing, Shanghai and Shenzhen still rank top in the world, but the prices of top luxury houses are lower than those in foreign countries.
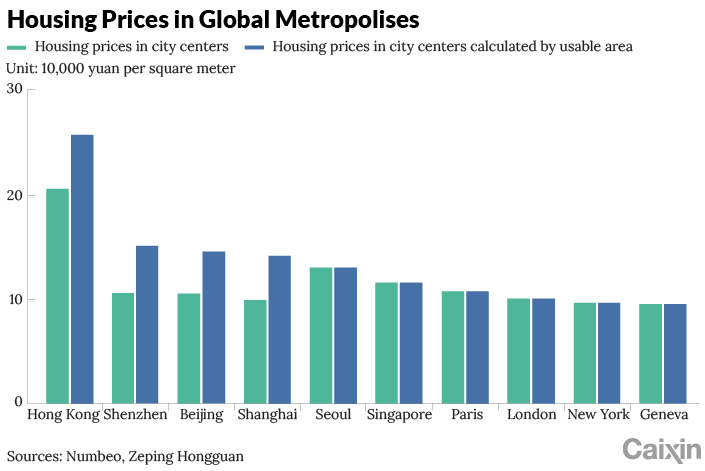
According to data released by Numbeo in June 2021, in terms of housing prices in central areas, Hong Kong ranks first, followed by Seoul in second place, Shenzhen in fifth, Beijing in sixth, London in seventh, Shanghai in eighth, and New York in ninth.
In terms of usage areas, real housing prices in central areas of Shenzhen, Beijing and Shanghai are higher than those in Seoul, only topped by Hong Kong. However, the unit price of top luxury houses in the central areas of first-tier cities in mainland China is lower than that in international metropolises.
For example, the most expensive mansion in downtown New York in 2021 is 432 Park Avenue in Midtown Manhattan, offering a panoramic view of New York’s Central Park, with a unit price of about 680,000 yuan ($104,865) per square meter, while the most expensive mansion in central Shanghai is Tomson Riviera, located in Lujiazui Financial District near the Huangpu River, with a unit price of about 280,000 yuan per square meter, or 400,000 yuan per square meter based on the usable area.
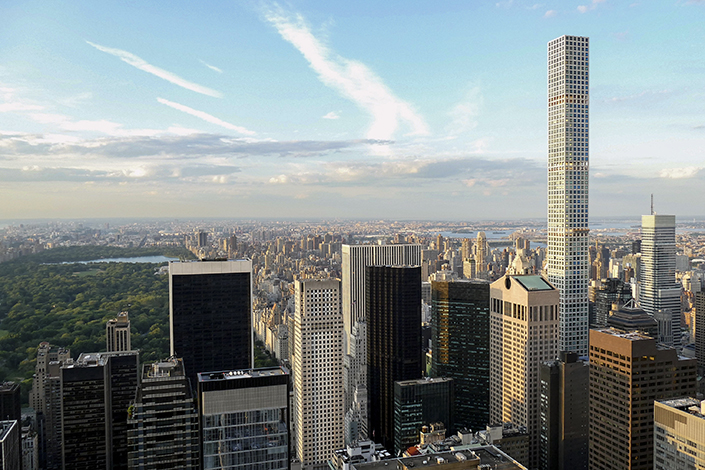 |
432 Park Avenue, the most expensive condominium in downtown New York, offering a panoramic view of the Central Park. Photo: VCG |
 |
Tomson Riviera, the most expensive mansion in central Shanghai, offering the view of Huangpu River. Photo: Tomson Riviera |
 |
Can rental cover the high price?
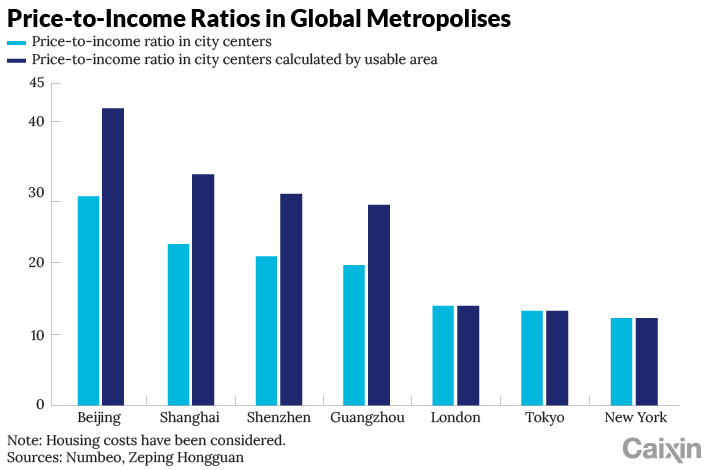
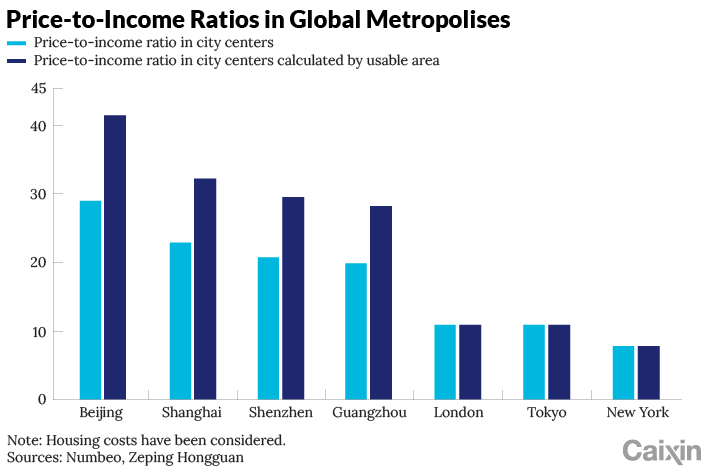
The housing price-to-income ratio of first-tier cities in mainland China is high, and the rental rate of return is less than 2.1%.
If calculated by usable area, the housing price-to-income ratio in the central areas of Beijing, Shanghai, Guangzhou and Shenzhen is 41, 32, 28 and 32 respectively, which is higher than New York (7), London (10) and Tokyo (10). In the peripheral areas, the number for Beijing, Shanghai, Guangzhou and Shenzhen are all above 10, also higher than the respective numbers of New York, London and Tokyo.
 |
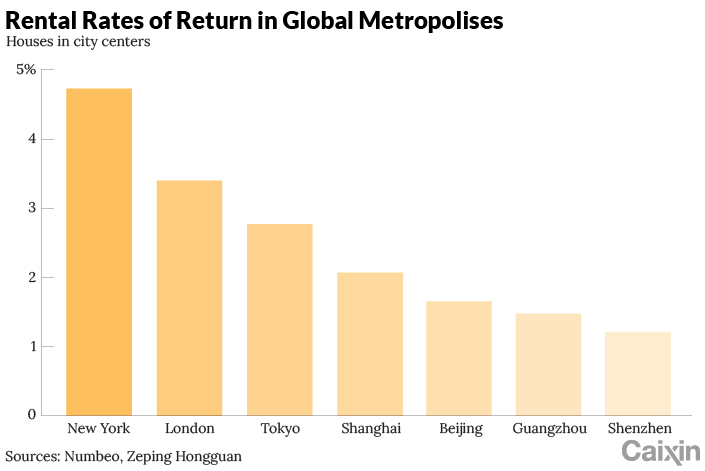
The rental rate of return in the center of Beijing, Shanghai, Guangzhou and Shenzhen is less than 2.1%, which is lower than New York’s 4.7%, London’s 3.4% and Tokyo’s 2.8%.
The rental rate of return is the ratio of the annual rent to the selling price of the house. A low rental rate of return means a low discount rate for investing in real estate. According to Numbeo’s June 2021 data, for the world’s 483 major cities, the average static rental rate of return in downtown areas is 5.63%, with a median of 4.65%, while that in peripheral areas was 7.45%, with a median of 5.33%. Among them, the rental rate of return in New York’s downtown and peripheral areas is 4.74% and 5.63% respectively, while that in London is 3.40% and 4.77%. These figures are much higher than those in China’s first-tier cities.
 |
How about house holding cost?
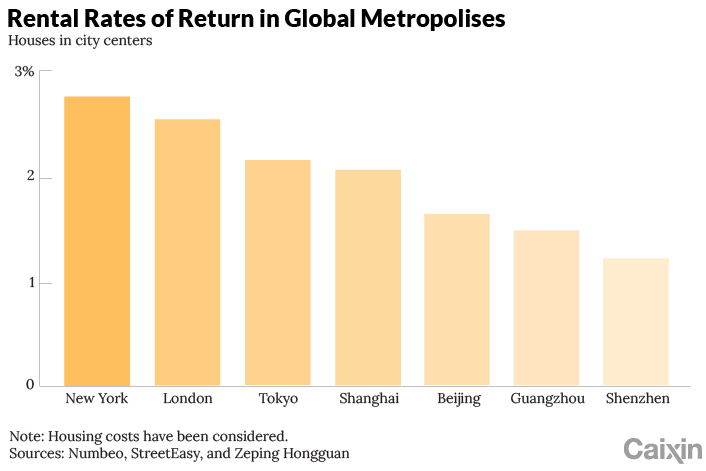
After considering the holding expenses, the relative housing price gap between China’s four major cities (Beijing, Shanghai, Guangzhou and Shenzhen) and international cities narrows.
International core cities generally levy real estate tax and set high property fees, making the holding cost significantly higher than that in the Chinese mainland. Except Shanghai and Chongqing where pilot projects are being carried out, real estate tax is yet to be launched in other cities in the Chinese mainland, and the property management company fees are relatively low.
After considering the holding cost, the housing price-to-income ratio in the center of New York, London and Tokyo is 12, 14 and 13 respectively, far below the corresponding numbers for China’s major cities, which are 42 in Beijing, 33 in Shanghai, 28 in Guangzhou and 30 in Shenzhen.
The rental rates of return in the center of New York, London and Tokyo are 2.7%, 2.5% and 2.1% respectively, compared to 1.6% in Beijing, 2.0% in Shanghai, 1.5% in Guangzhou and 1.2% Shenzhen, showing a narrowing gap.
[CHART 6]
|
 |
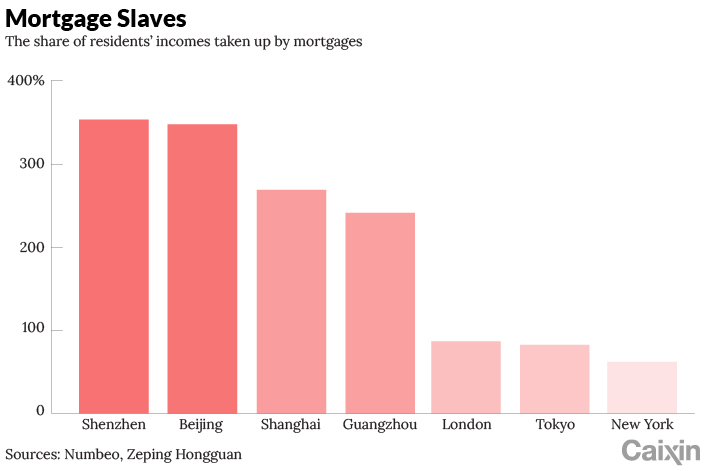
The ratios of housing loan rates to down payments in Beijing, Shanghai, Guangzhou and Shenzhen remain high.
The rates on first home loans in Beijing, Shanghai, Guangzhou and Shenzhen exceed 4.6%, while those in New York, London and Tokyo are all less than 3.6%. Calculated by commercial loans, the down payment ratio for ordinary residential buildings in Beijing is 35%–80%, while the percentage in New York is 10%–30%, and in London 5%–15%.
The pressure on housing loans of residents in Beijing, Shanghai, Guangzhou and Shenzhen ranks top worldwide, with mortgage loans accounting for more than 240% of their income, 3–4 times that of New York, London and Tokyo.
 |
What can you buy with 10 million yuan?
To enhance intuitive understanding, assuming that one wants to buy a house for personal use with a budget of 10 million yuan, let’s see what kind of house, and what kind of quality is affordable in the central and peripheral areas in Beijing, Shanghai, New York and London, including the holding cost. To enhance comparability, we narrowed the housing selection scope of the core area to 2.5 kilometers from the CBD or the financial business district and avoided properties for sale with comparably higher unit prices.
Residences in the core areas are not very different in terms of size.
Residences that people can buy with 10 million yuan near the core areas and CBDs of Beijing, Shanghai, New York and London are not much different in terms of size, which ranges from 61 to 68 square meters. Homeownership fees in New York and central London are much higher than in Beijing and Shanghai, with the fees in New York and London being upward of 160,000 yuan and 70,000 yuan, respectively, while those in Beijing and Shanghai are less than 7,000 yuan.
With 10 million yuan, people can afford residences with usable areas of roughly 76-124 square meters in peripheral zones of Beijing and Shanghai, but 130 and 180 square meters of usable areas in the peripheral zones of London and New York, respectively.
What are the main causes for the high housing prices in China’s core cities?
China has seen decades of urbanization, where people have been flowing into the first- and second-tier core cities. In the past decade, the population of first-tier cities has grown at an average annual rate of 2.37%, indicating that the population has continued to flow into these cities, but at a reduced speed. In second-tier cities, this number is 1.91%, showing that the population has also been continuously flowing into these cities at a slightly higher speed. The population of third- and fourth-tier cities grew at an average annual rate of 0.43% and -0.49%, respectively, showing a continuous population outflow.
In the long run, the development of real estate depends on the population size, and the flow of population depends on the development of industries which causes an increase in population. Looking abroad, people have continuously moved from low-income areas to high-income areas, demonstrating the process of urbanization and metropolitanization. A large amount of high-quality public resources, especially high-end industries, are concentrated in core cities on the Chinese mainland, into which people have long been flowing.
On top of that, “hukou,” or the household registration system, links access to public resources to registered permanent residence. The base of hukou is real estate, and that further reinforces the concentration of high-income people. Under the current hukou system, public resources such as regional education and medical care are connected to one’s hukou. Residences in core cities are more than buildings for living: they are intrinsically linked with access to scarce resources and higher-quality welfare. For example, although some cities grant families living in rented apartments access to the schools in the district where they live, a lot of other requirements need to be met, and usually that means that this group of residents are only able to send their children to the schools in that district if they also have hukou.
Internationally, although the U.S. also adopts the school district system, it is only necessary for families to have residency qualifications, renting included, in the school district. Moreover, good schools in the U.S. are relatively evenly distributed, rather than being concentrated in a few metropolises.
In addition, although the population growth of Beijing and Shanghai has slowed or even fallen into negative territory in recent years, the people leaving these cities are mainly from the low - and middle-income groups, while the inflow of high-income groups is likely to continue increasing.
 |
China’s urban-rural dual household registration system and land system cannot stimulate the effective allocation of population and land in the market. Migrant workers who cannot settle down in cities or are still migrating are unwilling to give up their rural homesteads for free. As a result, migrant workers “occupy” spaces in both urban and rural areas.
China’s urbanization strategy has long been inclined to “controlling the size of big cities and actively developing small- and medium-sized cities,” which deviates from the trend of population migration. In terms of size of cities, from 2006 to 2018, the urban population of cities with more than 10 million people increased by 46.8%, while construction land rose by only 41.7%; the population of cities with fewer than 200,000 people increased by 2.1%, and construction land rose by 22.9%.
Excessive money supply makes the growth of broad money supply faster than that of the nominal GDP, further pushing up real estate prices in first-tier cities. In China, the broad money supply (M2) has been growing at an average annual rate of 15% over the past four decades. Since 1998, the average annual compound growth rate of the new home prices reached 7.72%, nearly 8 percentage points lower than the M2 growth rate in the same period, whereas the growth of the home prices in first-tier cities basically kept pace with that of M2.
 |
In addition to the shortage of land supply, China has incomplete household income statistics, high savings rate and high economic growth rate, which make its price-to-income ratio and rental rate of return incomparable with other countries.
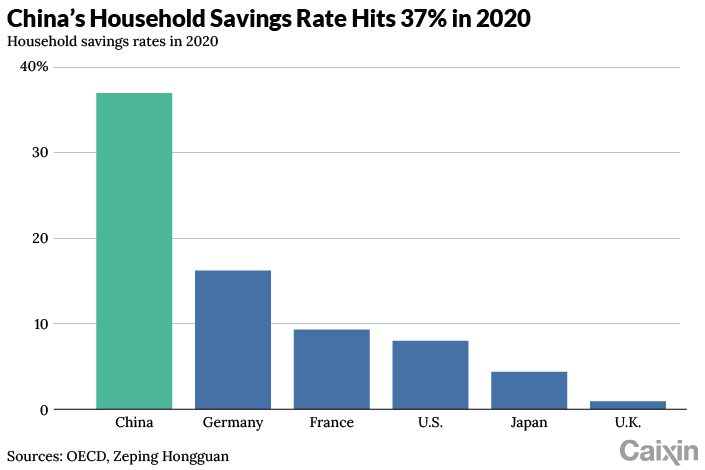
China’s economy is growing fast compared to other countries across the world, which is reflected in the housing prices in its core cities. China’s household saving rate is as high as 37%, more than four times that of developed countries in Europe and American countries, which has driven up the housing price-to-income ratio. According to OECD statistics, the household savings rate refers to the proportion of reserve balance in total disposable income. China’s household savings rate is much higher than that of European and American developed countries. In 2020, the savings rate of Chinese residents was as high as 37%, while those of the U.S., Britain, France, Germany and Japan were only 8%, 1%, 9%, 16% and 4%, respectively. High savings rate means Chinese households have relatively ample cash reserves to buy residences, which in turn pushes up the price-to-income ratio to an even higher level.
 |
Due to a number of factors the actual purchasing power of core urban residents is underestimated and house price-to-income ratio is overestimated. These include the concealing and under-reporting of income, high population mobility, people moving to a city solely for earning money but not for settling down and parents providing part of the down payment for their children.
First, due to such factors as the concealing and under-reporting of income in surveys, the average annual disposable income of households measured by the National Bureau of Statistics is not complete. In official surveys, people pay more attention to their privacy rights and high-income groups are rarely included in the survey samples. In developed economies, however, residents are required to report all their income, which is the basis on which taxes are collected. Those who intentionally conceal or under-report their incomes can be severely punished. Thus, the statistics on individual incomes in the developed economies are closer to the real incomes. Second, a large number of migrants come to core cities only to earn money but not to settle down, so the actual purchasing power of the residents in the core cities is underestimated. There are a large number of migrant workers and other non-native inhabitants in China’s cities, especially in the core cities. It is difficult for these migrants to settle down in these cities, but these low-income migrants are covered in the statistics of disposable income by the National Bureau of Statistics, resulting in an underestimation of the real purchasing power of native residents of the city. Third, according to Chinese tradition, young people’s housing purchase is often supported by what is called “six wallets” (parents and both sets of grandparents), that is, it is common for Chinese parents and even grandparents to pay a part of the down payment for their children and grandchildren.In the future, China should promote the new housing reform and speed up the construction of a long-term mechanism for real estate with the linking of people and land, currency control and property tax as the core. With the end of large-scale development and the reduction of land transfer fees and transaction tax in the era of house stocking, the introduction of property taxes will be a general trend.
This commentary was authored by Ren Zeping’s team. Bai Xuesong and Liu Yuxin contributed, as well as Jia Yaohe of Renmin University of China, who handled the data compilation.
Contact editor Michael Bellart (michaelbellart@caixin.com)
Download our app to receive breaking news alerts and read the news on the go.
Get our weekly free Must-Read newsletter.


- PODCAST

- MOST POPULAR