
Opinion: The Other U.S.-China Deficit
Editor’s note: The ongoing trade conflict between China and the U.S. has drawn attention to the intensifying rivalry between the world’s two largest economies. But despite American concerns about China’s rise, China still has some way to go before truly surpassing the U.S. in terms of key development indicators, Liu Peilin, a researcher at the development research center of China’s State Council, argues.
Liu’s essay has been translated from Chinese and edited for length.
Life expectancy
Achieving comprehensive human development is an important goal of China’s 19th Party Congress. Life expectancy is one of the main indicators of human development.
The life expectancy gap between China and the United States has shrunk over the past half century, but the average person in China can nevertheless still expect to live for fewer years than the average American. Chinese people born in 1960 could expect to live an average of 43.7 years, compared to their U.S. counterparts, who had a life expectancy of 69.8 years, according to the World Bank. As of 2016, the figures for China and the U.S. were 76.3 and 78.7 years, respectively.
 |
GDP and productivity
Per capita gross domestic product (GDP) is another important indicator of development. In 1960, the average person in China made the equivalent of $90 a year, while the average person in the U.S. made $3,000, meaning China’s GDP per capita was just 3% of that of the U.S. in 1960, according to World Bank data. The gap had widened even further by 1978, the year China started opening up to the world and implementing large-scale economic reform. In 1978, China’s GDP per capita was the equivalent of $156 at the time, while that of the U.S. was $10,587, meaning the average Chinese person made 1.5% what her American counterpart made that year.
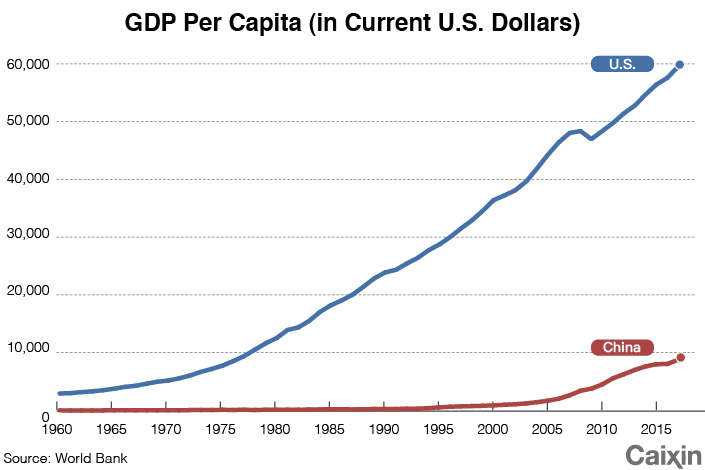 |
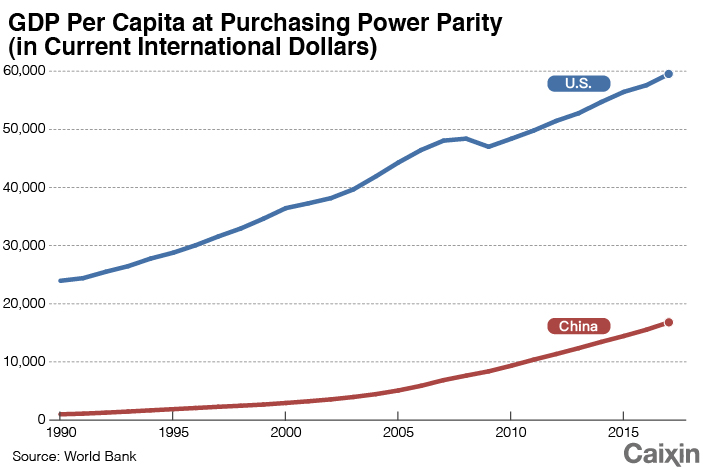
If you look at the two countries’ GDP per capita adjusted for purchasing power parity — that is, factoring in how much the equivalent amount of each currency can buy you — China’s GDP per capita is 28% that of the U.S.
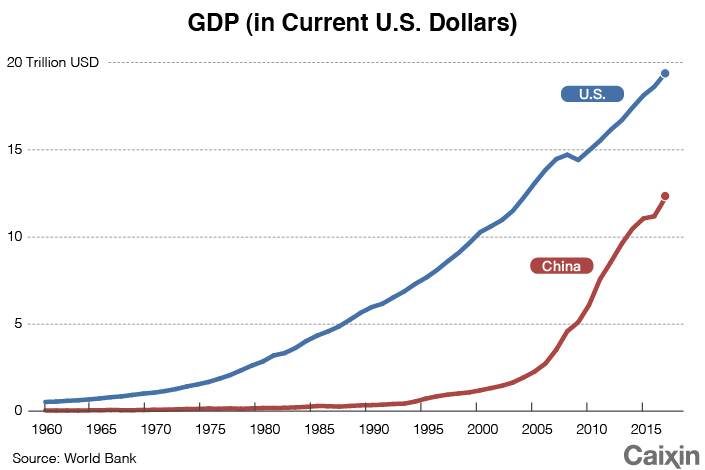
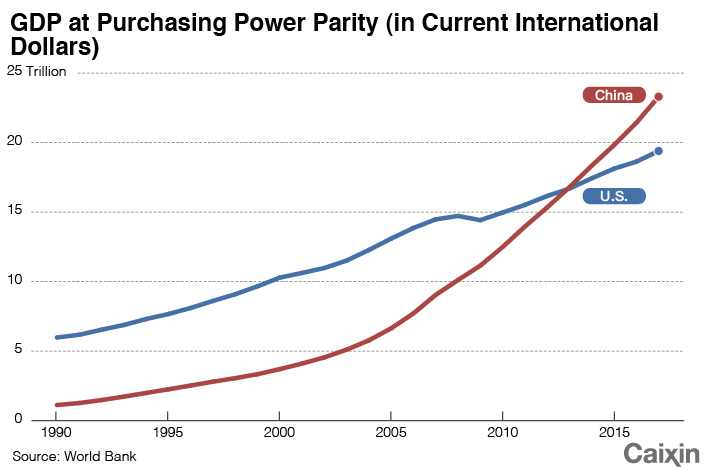
When it comes to the size of the economy as a whole, though, the gap between China and the U.S. is narrower. China’s GDP in 2017 was equivalent to $12.2 trillion, or 63.1%, the value of the GDP of the U.S., which was $19.4 trillion. If you look at the two countries’ GDP at purchasing power parity, China theoretically overtook the U.S. in 2013, and its 2017 GDP is 1.2 times that of the United States.
 |
There are three main issues China should be vigilant about.
The first is the possibility that China’s GDP could shrink, which has happened multiple times throughout history. According to figures compiled by British economic historian Angus Maddison, in 1870 the Chinese economy was the world’s largest, nearly double the size of the U.S. economy. But within three short decades, the U.S. overtook China thanks to its higher per capita GDP growth and population expansion, while China suffered a downward slide in per capita GDP and negative population growth. The Chinese have been striving to regain their former status ever since. In the future, as China works toward its goal, it should remember the lessons of history.
 |
 |
Today, China is a global manufacturing and trade powerhouse. The portion of China’s GDP deriving from technology is relatively close to the figure for developed Western countries. But China should be aware that it still lags significantly behind the U.S. in terms of technology.
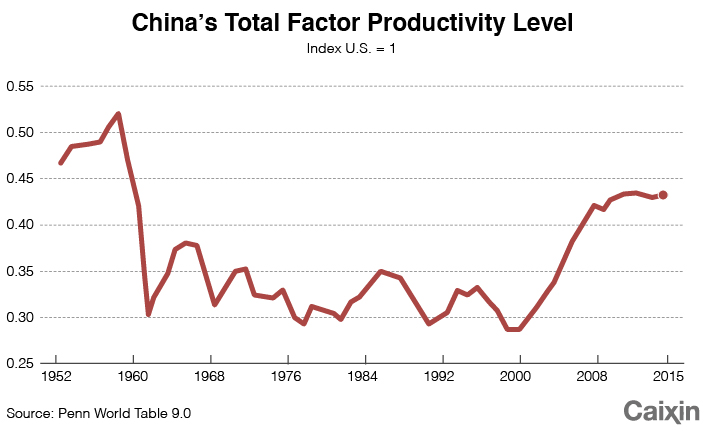
The third issue is that having the world’s second-largest or largest GDP does not necessarily mean that China has the world’s highest productivity rate. In the long term, productivity is everything. Ultimately, competitions between civilizations, countries, and social systems all boil down to productivity. That is why the work report of the 19th Party Congress called for China to increase its total factor productivity level — the part of its output that doesn’t come from increases of labor and capital input, but rather from how efficiently these factors are used.
China’s total factor productivity level compared with the U.S. fell in the middle of the 20th century, before rising again after the implementation of reform and opening up. In 2017, China was 43% as productive as the U.S, according to the latest Penn World Table. Until China’s productivity potential is fully realized, we cannot say for sure that it will continue to lag behind the U.S. in the future. But the evidence currently available also doesn’t support the conclusion that China has now surpassed the United States.
 |
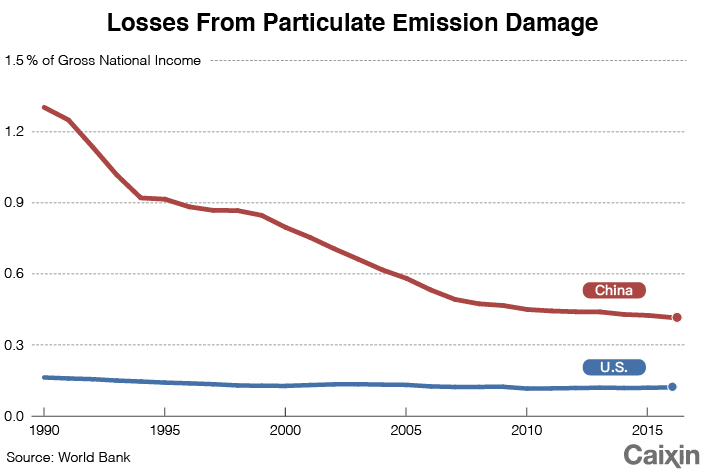
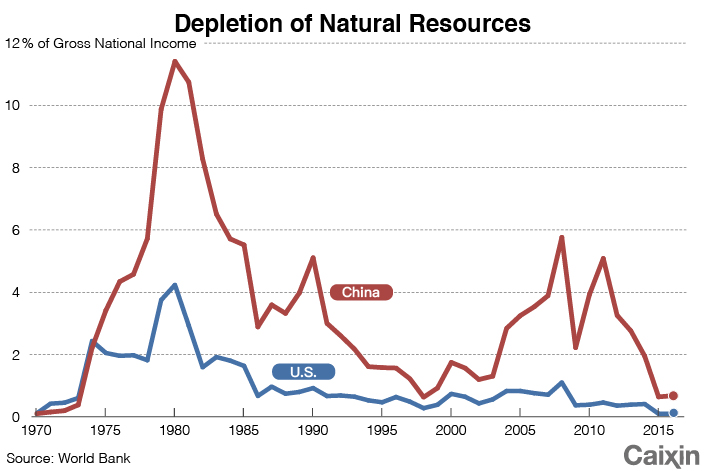
The state of a country’s natural environment is another important indicator of development. Judging from the available data, China still has a long way to go in this area, especially in comparison with the U.S. The losses caused by air pollution, as a percentage of China’s gross national income (GNI), have fallen rapidly in the past 30 years, but are still significantly higher than the losses caused by pollution in the U.S. As of 2016, China’s losses from particulate emission damage were 0.42%, compared to 0.12% in the U.S., according to World Bank data.
 |
 |


- 1Chinese Politburo Member’s Downfall Exposes Shadowy Network Tied to Evergrande, Vanke
- 2Hong Kong Grapples With Near-One-Year High in Covid-19 Infections
- 3Former Politburo Member Ma Xingrui Expelled From Party, Faces Criminal Prosecution
- 4Chinese Consumers Tighten Purse Strings Despite Modest Income Gains
- 5Analysis: China’s AI Boom Masks a Deepening Economic Divide

- 1Power To The People: Pintec Serves A Booming Consumer Class
- 2Largest hotel group in Europe accepts UnionPay
- 3UnionPay mobile QuickPass debuts in Hong Kong
- 4UnionPay International launches premium catering privilege U Dining Collection
- 5UnionPay International’s U Plan has covered over 1600 stores overseas